TLC vs QLC: What Four Bits Per Cell Actually Costs
Two drives, same capacity, same headline write speed, different flash. What changes is sustained write, cold-read speed, and what the datasheet omits.
Two 2TB NVMe drives, same brand, same PCIe generation, both printed with a sequential write figure near 5,000 MB/s. One costs noticeably less. Neither box explains why, and on most retail listings neither does the spec table. The difference is usually how many bits each flash cell holds, and it is the one specification that decides how the drive behaves after the first thirty seconds of a large transfer.
The letters describe a voltage measurement
A flash cell does not store a “1” or a “0” as such. It stores electric charge, and the amount of charge sets how much voltage the cell needs before current flows through it. That figure is the cell’s threshold voltage, and reading the cell means comparing it against a reference.
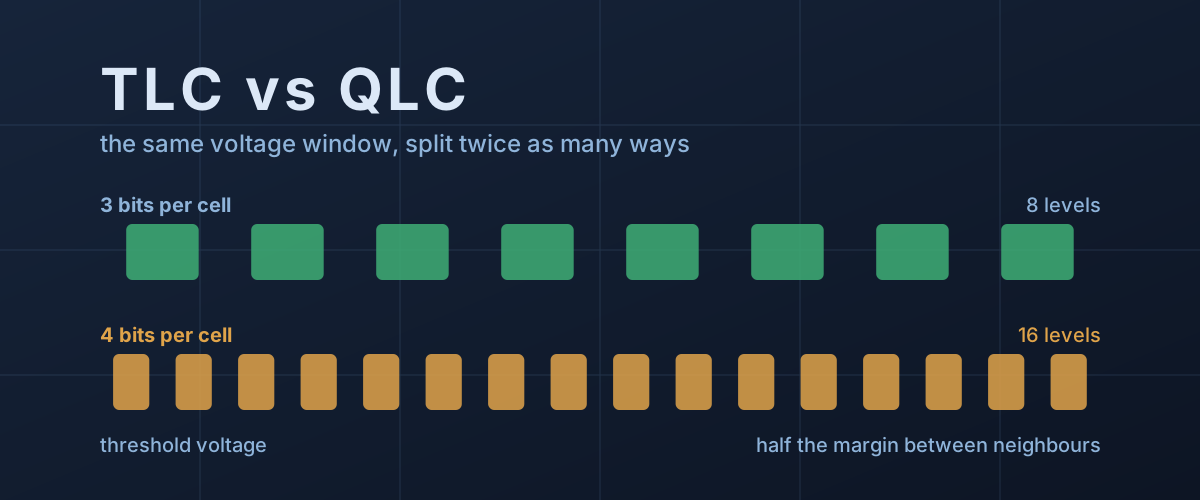
Everything follows from how many distinguishable bands you carve that voltage range into. Kioxia’s explanation of multi-level cell technology puts the arithmetic plainly: when a cell stores N bits, the number of threshold voltage distributions it must hold is two to the power of N. One bit per cell (SLC) needs 2. Three bits (TLC) needs 8. Four bits (QLC) needs 16.
The voltage range does not get any wider. Each bit you add halves the room between one level and its neighbour.
Three consequences fall straight out of that geometry, and Kioxia names all three. Writing gets slower, because placing charge precisely enough to land inside a narrow band takes more program-and-verify steps. Reading gets slower, because resolving which of sixteen bands a cell sits in takes more work than resolving which of eight. And the usable life is shorter, because every erase cycle degrades the cell slightly and blurs its distribution, and a QLC cell has half as much slack as a TLC cell before neighbouring bands start to overlap.
So why does the box say the same number for both?
Because the number on the box is not measured on QLC flash. It is measured on a pseudo-SLC cache: a region of the drive’s own flash temporarily operated at one bit per cell, which absorbs incoming writes at the fastest speed the chip can manage and gets folded down into its native TLC or QLC form later. We covered the general shape of this in why an SSD slows down copying large files; the part that matters here is the exchange rate.
A block running in single-bit mode holds a fraction of its native capacity. On a TLC drive that fraction is a third. On a QLC drive it is a quarter, which Tom’s Hardware confirmed directly when it measured a Crucial P3 Plus absorbing about 550GB of writes on a 2TB drive. So a QLC drive buys its headline speed by spending four cells of eventual capacity for every one cell of buffer, and it has to fold that data down at the slow native speed before the space comes back.
Samsung’s SATA pair from the start of the decade is the cleanest illustration, because the two datasheets are laid out identically and both print the number that modern ones leave out. The 870 EVO is 3-bit flash. The 870 QVO is 4-bit. Same controller, same interface, same “up to 530 MB/s” sequential write on the front page. Then footnote 3 on each:
- 870 EVO, 1TB and above: 530 MB/s after the TurboWrite region.
- 870 QVO, 1TB: 80 MB/s after the TurboWrite region. 160 MB/s at 2TB and up.
Identical headline, six times apart on the number that governs a transfer big enough to notice.
Reads get slower too, and that is the part people miss
Write speed gets all the attention because it is where the cliff is dramatic. But read speed is affected by the same geometry, and it hits data you wrote weeks ago.
Samsung’s QVO datasheet says this out loud in footnote 4: low queue depth random reads after the TurboWrite region are 5.0K IOPS, against the 11,000 IOPS printed in the spec table. The table figure describes reading data that is still sitting in the cache. Once the drive has folded that data down to four bits per cell, reads of it run at less than half the advertised rate.
That matters for exactly the workload people reach for a cheap high-capacity drive to hold. A game library is written once and read thousands of times, and after a month everything in it is native QLC.
The endurance gap is real, and it is narrowing
The wear argument used to be simple. On the Samsung pair, the 1TB 870 EVO is rated for 600TB written and carries a five-year warranty; the 1TB 870 QVO is rated for 360TB and three years. The ratio holds across the range: 1,200TB against 720TB at 2TB, 2,400TB against 1,440TB at 4TB.
It is no longer that simple. Sandisk’s current WD Blue SN5100, a QLC line from top to bottom, rates its 1TB model at 600TB written with a five-year warranty: the same commitment the TLC 870 EVO carried at that capacity. Four bits per cell is still physically harder on the flash, but process improvements and better error correction have moved the warranted figure to where TLC sat a few years ago, so “it is QLC, therefore it will wear out” has stopped being a reliable shortcut.
Two cautions. A TBW rating is a warranty commitment rather than a physical limit, which is a distinction worth understanding on its own (what TBW actually promises). And inside that same SN5100 line, endurance does not scale with capacity: 300TB at 500GB, 600TB at 1TB, 900TB at 2TB, 1,200TB at 4TB. The 4TB model gets twice the space of the 2TB but a third more write budget.
QLC is not one thing
The strongest reason to stop treating the letters as a verdict is how far apart two QLC drives can be.
Tom’s Hardware measured the Crucial P3 Plus in 2022 dropping from 4.4 GB/s to 100 MB/s once its cache filled. It measured the WD Blue SN5000 in 2024 dropping from roughly 5 GB/s to about 544 MB/s, and concluded that this generation of QLC flash “has, in a way, caught up to baseline TLC flash performance.”
Same four bits per cell. More than five times apart in the number that decides whether a 200GB copy finishes in minutes or in an hour. Flash generation and cache design matter more than the acronym.
The datasheet has quietly stopped telling you
Samsung printed the post-cache figure in a footnote in 2020. The SN5100 datasheet, dated August 2025, names QLC in its NAND Type row and quotes 6,700 MB/s sequential write, and contains no sustained figure anywhere.
The flash type can also change under a name you already trust. Sandisk’s own solution brief for the SN5100 states that the SN5000 it replaces used TLC at 500GB through 2TB, while the SN5100 is QLC across the line. The generational swap is documented, just not on the retail page, and the brief is honest enough to put “Can QLC SSDs Keep Up?” in as a heading.
So four things are worth checking, in roughly this order:
- The NAND Type row in the manufacturer’s own datasheet PDF, not the retail listing. It is often the only place the flash is named.
- TBW per terabyte across the capacities in one line. A tier whose endurance stops scaling with the tier below it usually marks where the flash changed.
- An independent sustained-write graph. This is the figure that has disappeared from datasheets, and it is the one that predicts what a large transfer will do.
- How full you plan to keep it. Most caches are dynamic, carved out of free space, so a drive kept at 85% has a fraction of the buffer it had empty.
Which jobs run outside the cache
The practical question is never “TLC or QLC”. It is whether your workload spends its life inside the cache or outside it.
Work that mostly stays inside: an operating system drive, application installs, a game library, importing a few gigabytes of photos. Writes arrive in bursts with idle time after them, which is exactly the pattern pseudo-SLC caching is designed for, and it is why a QLC drive can outscore an older TLC drive on a burst benchmark.
Work that runs outside: a backup target taking its first full image, video capture or a scratch disk for an edit, cloning a drive, seeding a large library, anything that writes more than the cache holds without stopping. Here the sustained figure is the only one that matters, and between 80 MB/s and 544 MB/s is the difference between an afternoon and a coffee break.
And read-heavy work on cold data sits in its own category. The QLC read penalty applies whether or not you ever hit a write cliff, because it applies to data that has already been folded down.
The letters on the flash are a useful first signal and a bad conclusion. The two numbers that actually decide the outcome, how much the cache absorbs and what the drive does afterwards, are increasingly absent from the page you are buying from. Knowing to go and find them is most of the job.