What TBW Actually Promises, and What It Doesn't
Every SSD lists an endurance rating in terabytes written. It is a warranty boundary derived from a lab workload, not a prediction of when the drive dies.
Two 1 TB SSDs. One is rated 600 TBW, the other 360. The number has units, it appears on the manufacturer’s own datasheet, and it looks like it ought to settle something. It mostly doesn’t, because it isn’t measuring the thing most people read it as measuring.
TBW stands for terabytes written: the total volume of data the host can send to the drive over its life. Read plainly, it sounds like a fuel tank. Write 600 TB and the drive is spent. That reading produces a specific anxiety, usually phrased as “am I going to wear this thing out”, and the honest answer involves understanding where the number comes from.
The rating starts as a property of the flash, not the drive
A NAND cell stores a charge behind an insulating oxide layer. Reading the cell only senses that charge. Programming and erasing it require forcing charge across the insulator, and, as Western Digital’s white paper on SSD endurance and HDD workloads explains, repeated program-erase cycling degrades that oxide layer, until it no longer insulates well enough to keep the charge where it was put.
What the degradation actually costs you is subtler than failure. A worn cell does not stop accepting writes. It stops holding a value for as long. Western Digital’s account treats endurance and data retention as two sides of one coin, inversely related: the more cycles a cell has been through, the shorter the period it can be trusted to keep what it was given.
That is the promise underneath the whole rating, and it is a promise about unplugged drives. The JEDEC standard that governs client SSD endurance, JESD218, pairs its endurance requirement with a retention requirement of one year at 30°C with the power off. So the question the NAND vendor is really answering is not “how many cycles until this cell breaks” but “how many cycles until it can no longer guarantee a year of powered-off retention.”
Getting from cycles to a number on the box
You cannot count PE cycles from the outside, and the drive writes more than you do. The flash translation layer relocates data to level wear, garbage collection rewrites partially stale blocks to reclaim them, and all of that costs cycles you never asked for. The ratio between flash writes and host writes is write amplification, and Western Digital lists what moves it: erase block sizes, overprovisioning, the amount of DRAM, firmware, and the workload, which it singles out as one of the most impactful. Large sequential writes amplify very little. Small scattered writes amplify a lot.
Which means a vendor cannot publish an endurance figure without first fixing a workload. That is what the companion standard, JESD219, exists for. The client workload is not a synthetic pattern, it is a recorded trace of the I/O a real PC with an operating system installed issued over an extended period, played back to the drive. The vendor runs it, observes how much amplification it produces, and works backwards:
Every capacity lands on the same daily rate
Here is where the number stops behaving like a measurement.
Samsung’s 990 EVO Plus datasheet lists 600, 1200 and 2400 TBW for its 1, 2 and 4 TB models, with a five-year warranty. Samsung’s 870 QVO datasheet lists 360, 720, 1440 and 2880 TBW for 1, 2, 4 and 8 TB, with a three-year warranty. Different NAND (the first is TLC, the second is what Samsung calls 4-bit MLC, which the rest of the industry calls QLC), different interface, four years apart in release.
Divide each of those nine ratings by its capacity, then by the number of days in its own warranty term, and they all produce the same figure:
- 600 TB ÷ 1 TB ÷ 1,825 days = 0.33 drive writes per day
- 360 TB ÷ 1 TB ÷ 1,095 days = 0.33 drive writes per day
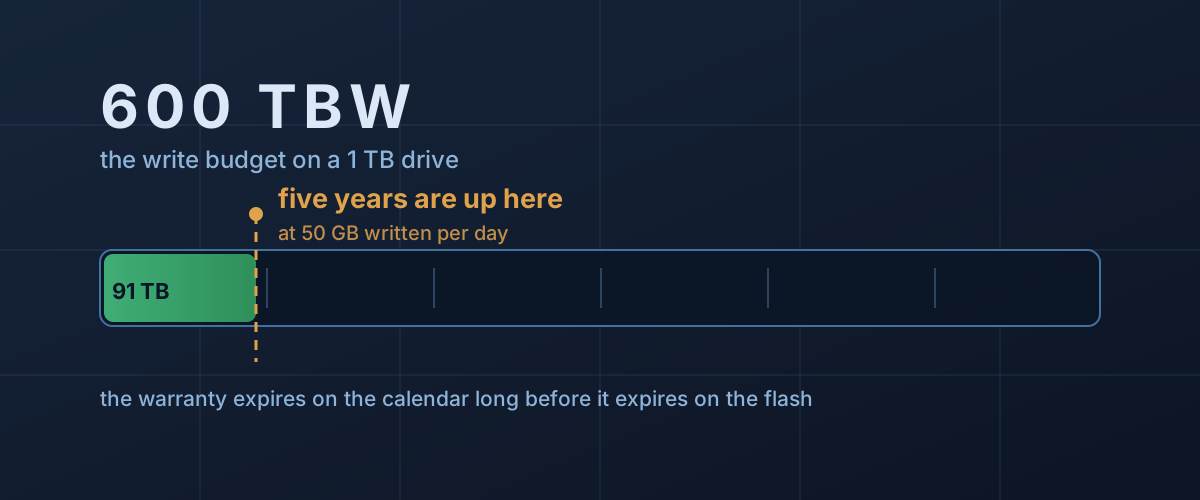
Every capacity, both product lines. The 1 TB 990 EVO Plus is not rated to absorb more daily writing than the 1 TB 870 QVO. It is rated to absorb the same daily writing for two more years. Whatever the JESD219 run measured, the number that reached the datasheet is the warranty term restated as a volume of data.
That is not a scandal, it is how a warranty limit is supposed to be set. But it does tell you what the figure is for. A rating that is constructed to expire alongside the warranty is not an independent estimate of the drive’s lifespan.
Two clocks, one coverage
The manufacturers say this outright if you read the warranty rather than the marketing. Samsung’s SSD limited warranty document covers the product for the shorter of the stated warranty period or “the period ending on the date when the SSD has exceeded its TBW (total bytes written) threshold”. The 990 EVO Plus datasheet footnote puts it in one line: coverage runs “for the stated time period or the TBW, whichever comes first.”
So the useful question is not whether 600 TB is a lot. It is which clock runs out first for you. On that 1 TB drive, the two tie at roughly 329 GB written every single day for five straight years.
What the rating does not tell you
It does not tell you how likely the drive is to fail. Western Digital says so about as plainly as a vendor can: an endurance rating should not be read as having any meaningful relationship to how likely the drive is to fail. Mean time between failures and annualised failure rate describe something else entirely, a statistical model of the electrical components giving out, which the paper calls “mostly unrelated to endurance.”
The two Samsung datasheets demonstrate it. The TLC drive rated at 600 TBW per terabyte and the QLC drive rated at 360 both list an MTBF of 1.5 million hours. The endurance figures differ by a factor of 1.7 and the reliability figures are identical, because they are answers to different questions. Endurance is about the flash wearing out. Failure is mostly about everything else in the enclosure: the controller, the power circuitry, a solder joint. If you are worried about losing data, the signals worth watching are not on the endurance spec at all.
Read your own drive instead of the datasheet
The rating assumes a workload. Your drive has been observing the real one since the day you installed it, and it keeps the tally.
On NVMe drives, the numbers live in the SMART/Health Information log, which is where smartctl says it reads NVMe attributes from. The command only reads:
smartctl -a /dev/nvme0Vendor utilities expose the same log with friendlier labels, and Samsung’s warranty document points owners at Magician to check their own TBW figure. Whichever tool you use, two fields matter. One counts total host writes, which you can divide by the drive’s age to get your real daily rate, and that is the number to put against the chart above. The other is the drive’s own percentage-used estimate, and it is the better of the two. Western Digital’s paper is explicit that “the most important metric for understanding a drive’s endurance will be the actual percentage life remaining provided by the drive firmware”, because that figure is computed from the PE cycles the NAND has actually taken rather than from host writes run through an assumed amplification factor. It accounts for how you write, not how the reference PC wrote.
For most desktops the answer to that division is undramatic and the exercise takes a minute. The point is that it replaces a guess with a measurement of your machine.
Where the number earns its keep
Three situations move the write rate far enough to matter.
Capacity, because the rating scales with it. Endurance is roughly proportional to how much NAND is in the package, which is why the per-terabyte figure is constant across every capacity in both datasheets. The consequence is that a fixed daily volume is a much larger fraction of a small drive. Writing 100 GB a day is 0.2 drive writes per day on a 500 GB drive and 0.025 on a 4 TB one, a difference of eight in how fast the same workload consumes the budget.
Workload shape, because it sets write amplification. The published figure carries one amplification factor baked into it. A workload of small scattered writes, a database, a busy virtual machine, a heavily written log, generates more flash writes per host write than the reference trace did, so it eats the real budget faster than your host write counter suggests. This is another reason the percentage-used figure beats arithmetic on terabytes written.
Free space, because spare capacity is what garbage collection works with. Overprovisioning appears on Western Digital’s list of the things that set write amplification. A drive kept near full gives the controller less room to consolidate valid data, so more of each erase block has to be rewritten to reclaim it.
What actually happens at 100%
Not very much, immediately. A drive that reaches its rating does not brick itself. Western Digital notes that such a drive “may be able to operate without electrical failure for a significant lifetime beyond its endurance rating”, while noting that read error rates climb sharply and the drive should no longer be trusted to hold data for any length of time. What expires at the rating is the retention guarantee, and there is no published curve for how fast retention falls away after that point.
That is the practical meaning of crossing the line: not a deadline, but the end of a warranty and the end of a promise about how long an unplugged drive holds its contents. If a drive you own is approaching its rated endurance, the sane response is to copy its contents somewhere else while everything still reads cleanly, and to stop relying on it as the only home for anything.
For the large majority of ordinary use, that moment arrives long after the drive has been replaced for being too small or too slow. The endurance figure was never really addressed to that reader. It was addressed to the warranty department.